安装、加载包
1、设置工作目录#设置工作环境rm(list=ls())setwd("D:\桌面\ggplot2调整柱状图柱子间距")2、安装、加载包
#安装包# install.packages("ggplot2")# install.packages("ggprism")#加载包library(ggplot2)library(ggprism)数据
这里使用编写数据,大家也可以导入自己的作图数据#数据df<-data.frame(group=c('A','B','C'),value=https://www.itzhengshu.com/ppt/c(3,5,7))基本绘图
p<-ggplot(df,aes(group,value,color=group,fill=group))labs(x="Samples",y=NULL)theme_prism(palette = "candy_bright",base_fontface = "plain",base_family = "serif",base_size = 16,base_line_size = 0.8,axis_text_angle = 45)scale_fill_prism(palette = "candy_bright")p geom_bar(stat="identity",position="dodge")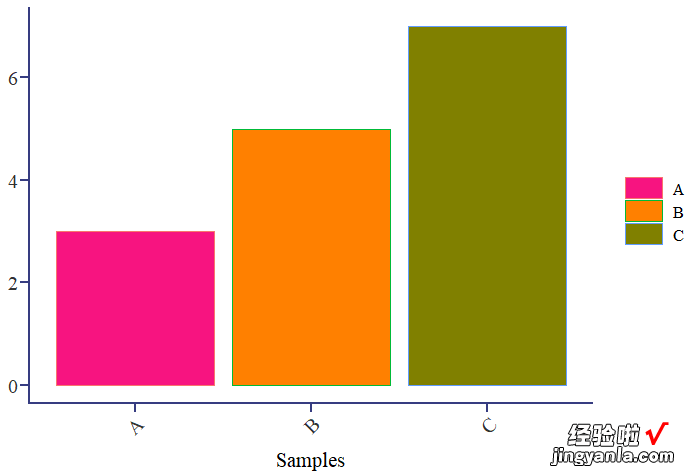
调整柱子宽度
【R可视化——ggplot2调整柱状图柱子宽度及间距】主要通过geom_bar函数中的width参数进行控制#调整柱子宽度p geom_bar(stat="summary",fun=mean,position="dodge",width =0.5)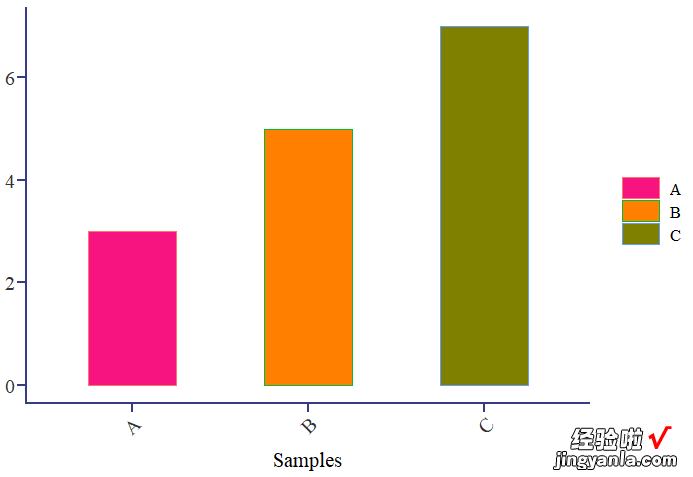
调整柱子间距
主要通过将X轴转变为连续变量并通过控制变量大小以改变柱间距离 , 我们先给原数据加一列连续变量:df$x<-c(1,2,3)#添加连续变量#绘图p1<-ggplot(df,aes(x,value,color=group,fill=group))geom_bar(stat="identity",position="dodge",width = 0.5)labs(x="Samples",y=NULL) #标题theme_prism(palette = "candy_bright",base_fontface = "plain",base_family = "serif",base_size = 16,base_line_size = 0.8,axis_text_angle = 45)scale_fill_prism(palette = "candy_bright")p1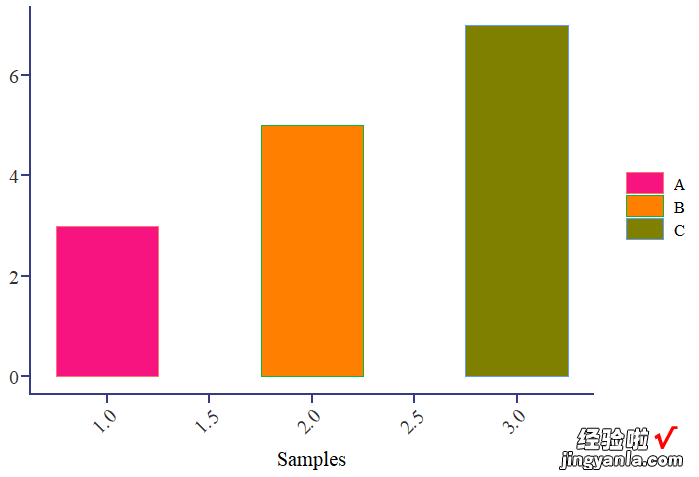
改变X轴及其标签
p1 scale_x_continuous(limits=c(0.5,3.5),breaks=c(1,2,3),labels = c('A','B','C'))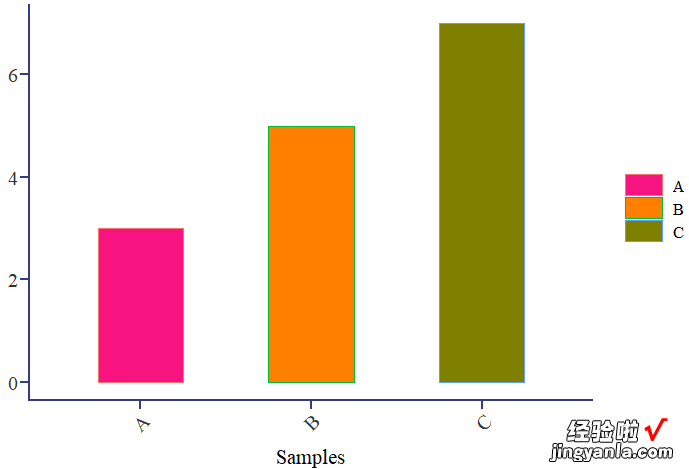
增大某两个柱子间的距离
df$x<-c(1,2,4)#改变连续变量值ggplot(df,aes(x,value,color=group,fill=group))geom_bar(stat="identity",position="dodge",width = 0.5)labs(x="Samples",y=NULL) #标题theme_prism(palette = "candy_bright",base_fontface = "plain",base_family = "serif",base_size = 16,base_line_size = 0.8,axis_text_angle = 45)scale_fill_prism(palette = "candy_bright") scale_x_continuous(limits=c(0.5,4.5),breaks=c(1,2,3,4),labels = c('A','B','','C')) #改变X轴theme(axis.ticks.x = element_blank())#关闭X轴刻度
更多精彩欢迎大家关注微信公众号—科研后花园?。。?/b>