今天经验啦讲解了Excel表格如何混合文本统计数据之和的操作流程,下文就是关于在Excel表格混合文本统计数据之和的操作方法 , 一起来学习吧!
Excel表格混合文本统计数据之和的操作方法

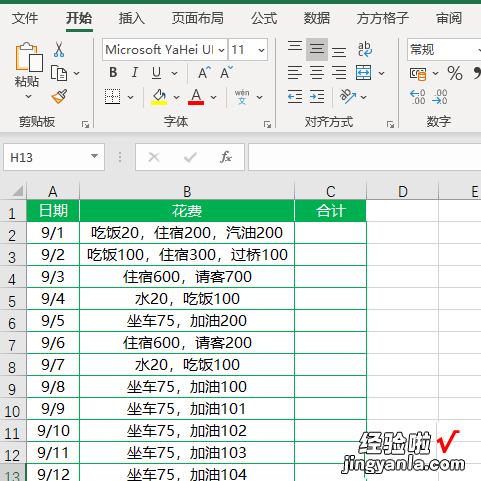
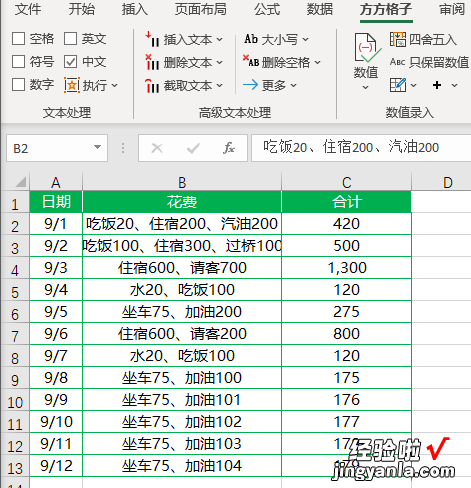
如图是老板发给小李的出差花费表,现在小李要汇总每一天的花费金额 。
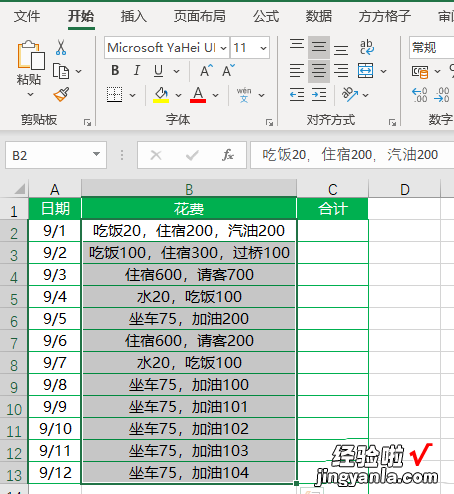
选中花费单元格数据区域
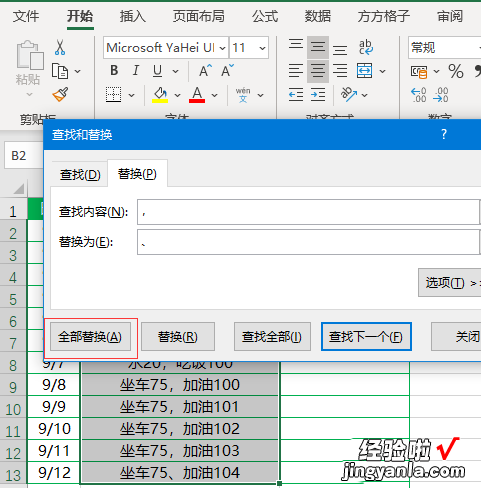
按下Ctrl+H将逗号替换为顿号
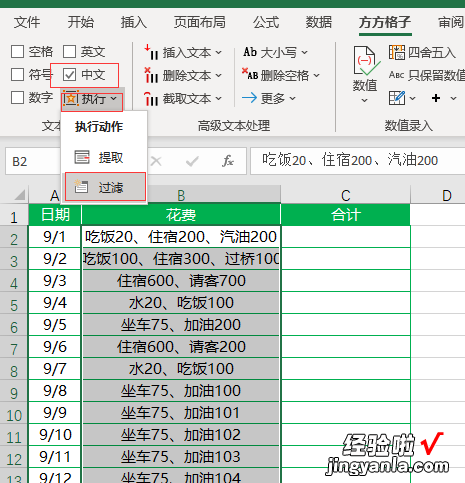
点击下图选项(Excel工具箱)

勾选【中文】 , 然后点击【执行】,选择【过滤】
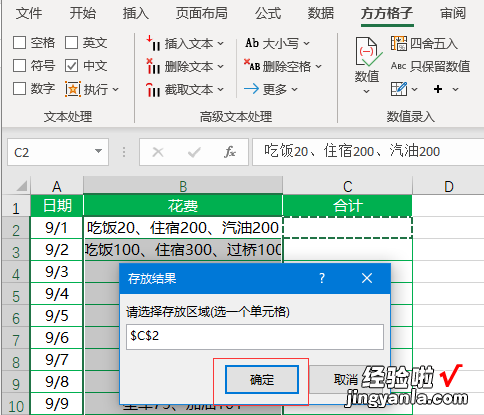
选择C2单元格作为存放位置,点击【确定】
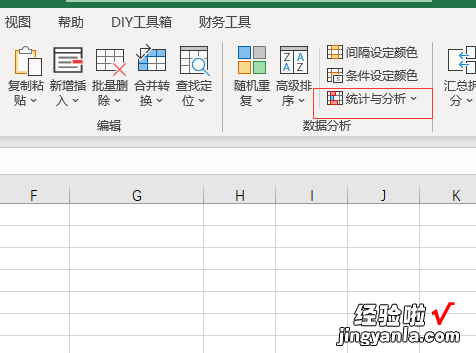
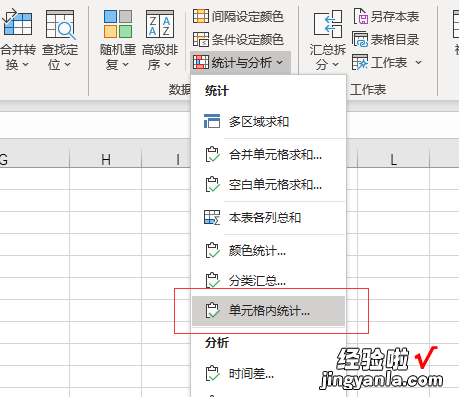
点击【统计与分析】
选择【单元格内统计】
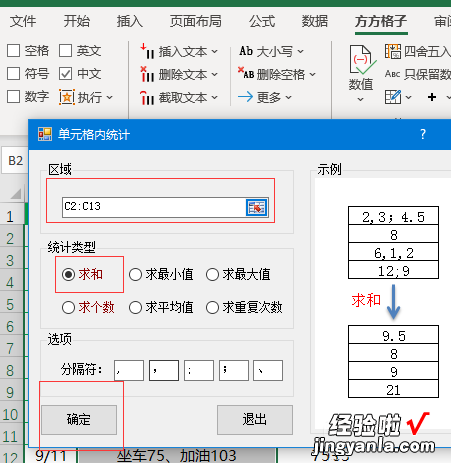
在【区域】选项中输入C2:C13,然后勾选【求和】,最后点击【确定】即可完成 。
【经验啦分享Excel表格混合文本统计数据之和的操作方法】
完成效果如图所示
上文就讲解了Excel表格混合文本统计数据之和的操作流程 , 希望有需要的朋友都来学习哦 。