Excel怎样制作对数图表?经验啦接下来就为大家介绍下关于Excel制作对数图表的具体操作方法,希望能帮助到大家!
Excel制作对数图表的具体操作方法

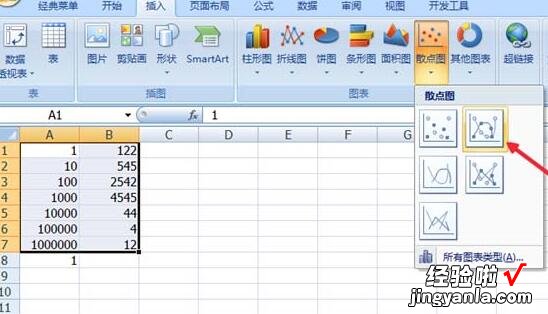
1、插入一个数据表格,选择数据,点击【插入】——【散点图】
【我来分享Excel制作对数图表的具体操作方法】
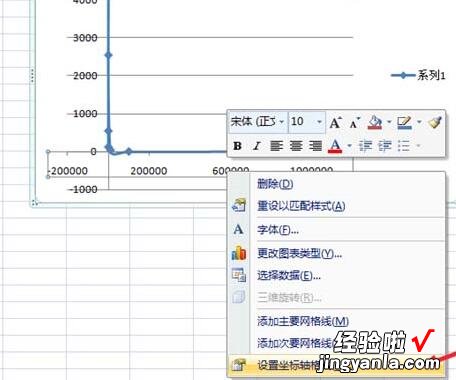
2、右击横坐标,选择【设置坐标轴格式】
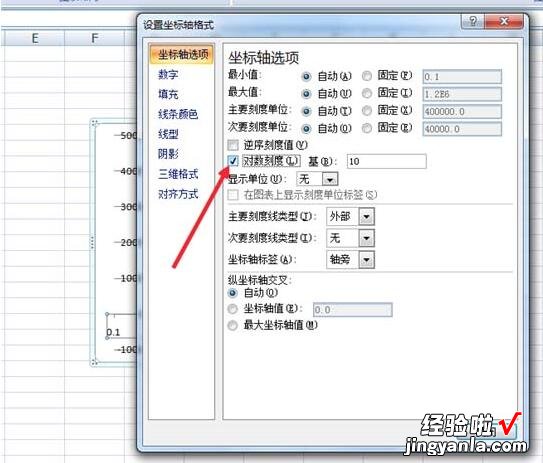
3、在弹出来的对话框中选择【坐标轴选项】——【对数刻度】,在前面的方框中打钩 。然后【关闭】
4、点击图表 , 在最上方的选项中点击【图表工具】——【布局】
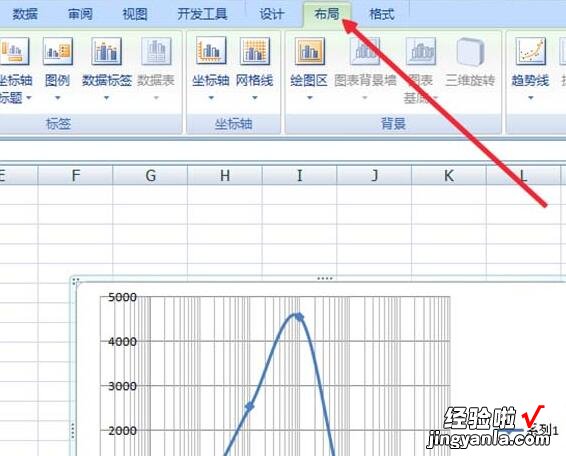
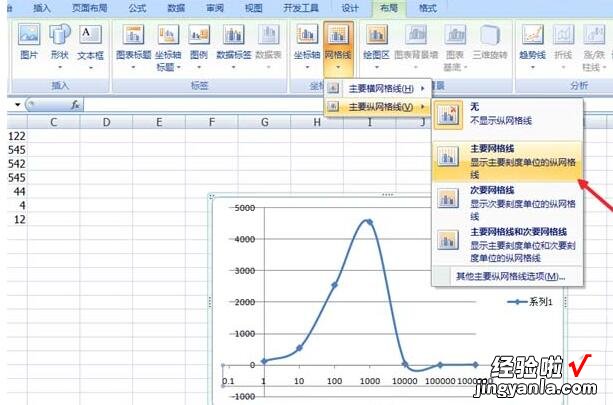
5、在【布局】中选择网格线,选择【主要纵坐标网格线】——【主要网格线】,当然也可以添加其他的横(纵)坐标主(次)要网格线 。
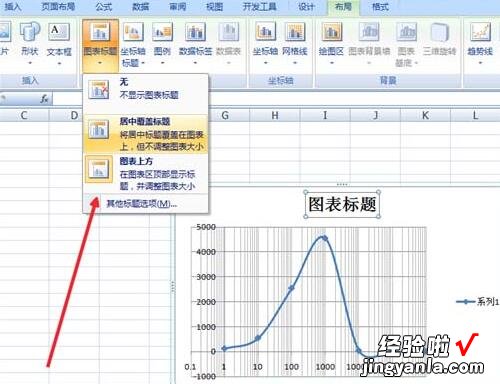
6、在添加网格线之后,还需添加标题,这样才算一个完整的图表 。依旧在【布局】中,选择【图表标题】,进行标题的添加 。
快来学习学习Excel制作对数图表的具体操作流程吧,一定会帮到大家的 。